|
Download Data (XLS File) |
|
|||||
|
|||||
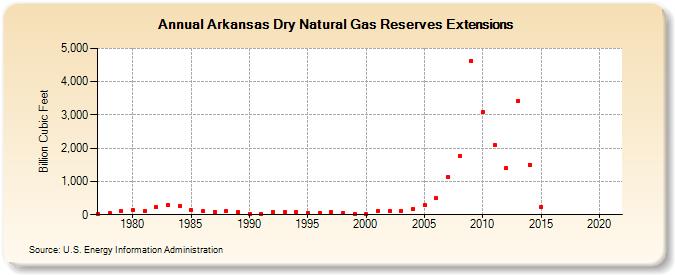
| Arkansas Dry Natural Gas Reserves Extensions (Billion Cubic Feet) | |||||
| Decade | Year-0 | Year-1 | Year-2 | Year-3 | Year-4 | Year-5 | Year-6 | Year-7 | Year-8 | Year-9 |
|---|---|---|---|---|---|---|---|---|---|---|
| 1970's | 23 | 37 | 108 | |||||||
| 1980's | 138 | 106 | 220 | 296 | 261 | 138 | 100 | 93 | 110 | 71 |
| 1990's | 35 | 27 | 88 | 76 | 92 | 59 | 57 | 96 | 45 | 27 |
| 2000's | 14 | 119 | 111 | 125 | 170 | 281 | 491 | 1,148 | 1,754 | 4,627 |
| 2010's | 3,082 | 2,093 | 1,399 | 3,419 | 1,505 | 242 | -- | -- | -- | -- |
| 2020's | -- | -- |
| - = No Data Reported; -- = Not Applicable; NA = Not Available; W = Withheld to avoid disclosure of individual company data. |
| Release Date: 12/30/2022 |
| Next Release Date: NA |