|
Download Data (XLS File) |
|
|||||
|
|||||
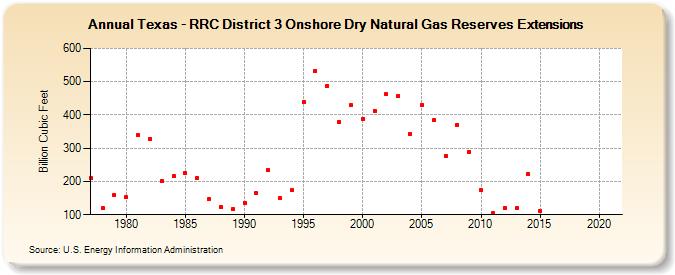
| Texas - RRC District 3 Onshore Dry Natural Gas Reserves Extensions (Billion Cubic Feet) | |||||
| Decade | Year-0 | Year-1 | Year-2 | Year-3 | Year-4 | Year-5 | Year-6 | Year-7 | Year-8 | Year-9 |
|---|---|---|---|---|---|---|---|---|---|---|
| 1970's | 210 | 119 | 159 | |||||||
| 1980's | 152 | 339 | 329 | 201 | 215 | 224 | 209 | 146 | 124 | 116 |
| 1990's | 136 | 164 | 233 | 149 | 173 | 439 | 533 | 488 | 378 | 429 |
| 2000's | 388 | 413 | 462 | 458 | 344 | 431 | 384 | 277 | 371 | 288 |
| 2010's | 175 | 104 | 121 | 119 | 222 | 112 | -- | -- | -- | -- |
| 2020's | -- | -- |
| - = No Data Reported; -- = Not Applicable; NA = Not Available; W = Withheld to avoid disclosure of individual company data. |
| Release Date: 12/30/2022 |
| Next Release Date: NA |