|
Download Data (XLS File) |
|
|||||
|
|||||
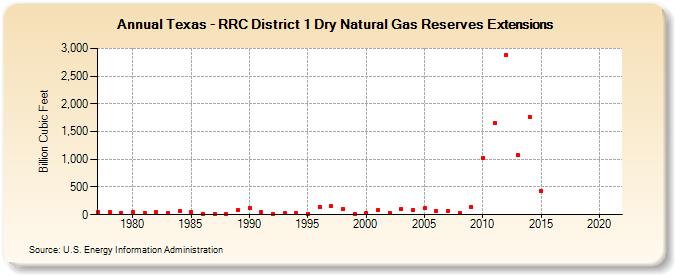
| Texas - RRC District 1 Dry Natural Gas Reserves Extensions (Billion Cubic Feet) | |||||
| Decade | Year-0 | Year-1 | Year-2 | Year-3 | Year-4 | Year-5 | Year-6 | Year-7 | Year-8 | Year-9 |
|---|---|---|---|---|---|---|---|---|---|---|
| 1970's | 46 | 46 | 30 | |||||||
| 1980's | 45 | 29 | 57 | 25 | 69 | 51 | 17 | 9 | 16 | 86 |
| 1990's | 128 | 47 | 13 | 24 | 30 | 21 | 142 | 149 | 108 | 19 |
| 2000's | 32 | 84 | 31 | 109 | 92 | 115 | 74 | 68 | 26 | 143 |
| 2010's | 1,023 | 1,657 | 2,884 | 1,076 | 1,766 | 433 | -- | -- | -- | -- |
| 2020's | -- | -- |
| - = No Data Reported; -- = Not Applicable; NA = Not Available; W = Withheld to avoid disclosure of individual company data. |
| Release Date: 12/30/2022 |
| Next Release Date: NA |