|
Download Data (XLS File) |
|
|||||
|
|||||
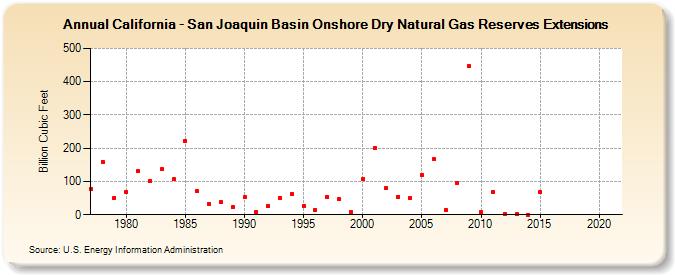
| California - San Joaquin Basin Onshore Dry Natural Gas Reserves Extensions (Billion Cubic Feet) | |||||
| Decade | Year-0 | Year-1 | Year-2 | Year-3 | Year-4 | Year-5 | Year-6 | Year-7 | Year-8 | Year-9 |
|---|---|---|---|---|---|---|---|---|---|---|
| 1970's | 78 | 159 | 51 | |||||||
| 1980's | 69 | 131 | 102 | 136 | 106 | 221 | 70 | 33 | 37 | 23 |
| 1990's | 53 | 8 | 27 | 51 | 62 | 27 | 15 | 53 | 46 | 8 |
| 2000's | 107 | 200 | 79 | 54 | 51 | 120 | 166 | 13 | 96 | 446 |
| 2010's | 8 | 69 | 3 | 1 | 0 | 69 | -- | -- | -- | -- |
| 2020's | -- | -- |
| - = No Data Reported; -- = Not Applicable; NA = Not Available; W = Withheld to avoid disclosure of individual company data. |
| Release Date: 12/30/2022 |
| Next Release Date: NA |