|
Download Data (XLS File) |
|
|||||
|
|||||
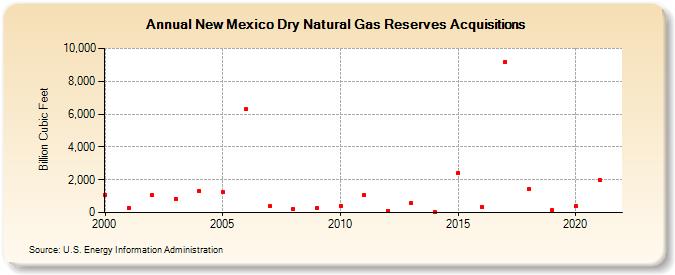
| New Mexico Dry Natural Gas Reserves Acquisitions (Billion Cubic Feet) | |||||
| Decade | Year-0 | Year-1 | Year-2 | Year-3 | Year-4 | Year-5 | Year-6 | Year-7 | Year-8 | Year-9 |
|---|---|---|---|---|---|---|---|---|---|---|
| 2000's | 1,087 | 307 | 1,052 | 852 | 1,323 | 1,238 | 6,278 | 376 | 192 | 292 |
| 2010's | 419 | 1,078 | 115 | 594 | 62 | 2,427 | 361 | 9,189 | 1,416 | 146 |
| 2020's | 398 | 1,969 |
| - = No Data Reported; -- = Not Applicable; NA = Not Available; W = Withheld to avoid disclosure of individual company data. |
| Release Date: 12/30/2022 |
| Next Release Date: NA |