|
Download Data (XLS File) |
|
|||||
|
|||||
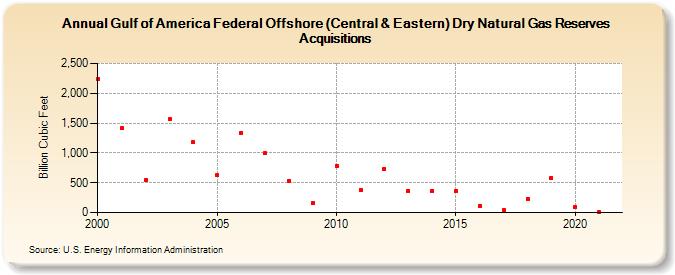
| Gulf of America Federal Offshore (Central & Eastern) Dry Natural Gas Reserves Acquisitions (Billion Cubic Feet) | |||||
| Decade | Year-0 | Year-1 | Year-2 | Year-3 | Year-4 | Year-5 | Year-6 | Year-7 | Year-8 | Year-9 |
|---|---|---|---|---|---|---|---|---|---|---|
| 2000's | 2,247 | 1,415 | 543 | 1,563 | 1,177 | 628 | 1,341 | 991 | 532 | 159 |
| 2010's | 785 | 385 | 734 | 363 | 364 | 365 | 117 | 43 | 228 | 583 |
| 2020's | 96 | 11 |
| - = No Data Reported; -- = Not Applicable; NA = Not Available; W = Withheld to avoid disclosure of individual company data. |
| Release Date: 12/30/2022 |
| Next Release Date: NA |