|
Download Data (XLS File) |
|
|||||
|
|||||
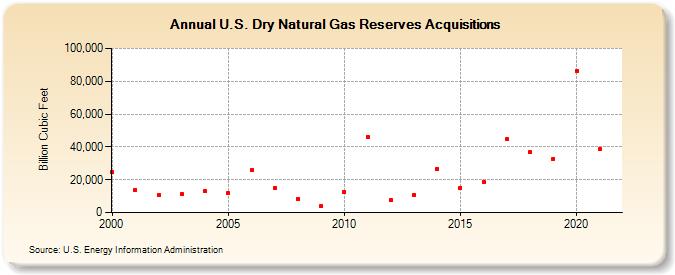
| U.S. Dry Natural Gas Reserves Acquisitions (Billion Cubic Feet) | |||||
| Decade | Year-0 | Year-1 | Year-2 | Year-3 | Year-4 | Year-5 | Year-6 | Year-7 | Year-8 | Year-9 |
|---|---|---|---|---|---|---|---|---|---|---|
| 2000's | 24,409 | 14,010 | 10,546 | 11,208 | 12,950 | 11,674 | 25,846 | 15,148 | 8,498 | 3,968 |
| 2010's | 12,748 | 46,241 | 7,518 | 10,810 | 26,675 | 15,231 | 18,797 | 44,738 | 36,719 | 32,894 |
| 2020's | 86,434 | 38,610 |
| - = No Data Reported; -- = Not Applicable; NA = Not Available; W = Withheld to avoid disclosure of individual company data. |
| Release Date: 12/30/2022 |
| Next Release Date: NA |