|
Download Data (XLS File) |
|
|||||
|
|||||
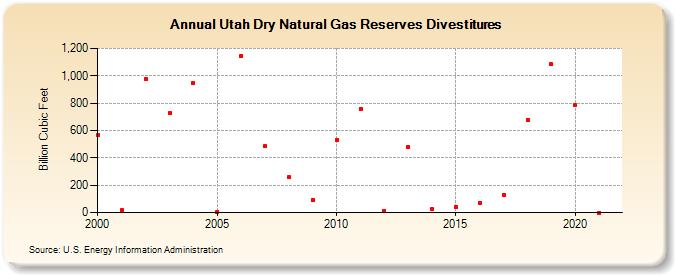
| Utah Dry Natural Gas Reserves Divestitures (Billion Cubic Feet) | |||||
| Decade | Year-0 | Year-1 | Year-2 | Year-3 | Year-4 | Year-5 | Year-6 | Year-7 | Year-8 | Year-9 |
|---|---|---|---|---|---|---|---|---|---|---|
| 2000's | 568 | 17 | 978 | 729 | 946 | 6 | 1,147 | 484 | 258 | 92 |
| 2010's | 530 | 758 | 12 | 478 | 23 | 42 | 73 | 129 | 677 | 1,083 |
| 2020's | 783 | 0 |
| - = No Data Reported; -- = Not Applicable; NA = Not Available; W = Withheld to avoid disclosure of individual company data. |
| Release Date: 12/30/2022 |
| Next Release Date: NA |