|
Download Data (XLS File) |
|
|||||
|
|||||
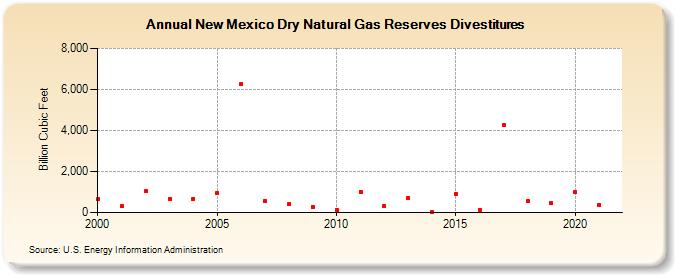
| New Mexico Dry Natural Gas Reserves Divestitures (Billion Cubic Feet) | |||||
| Decade | Year-0 | Year-1 | Year-2 | Year-3 | Year-4 | Year-5 | Year-6 | Year-7 | Year-8 | Year-9 |
|---|---|---|---|---|---|---|---|---|---|---|
| 2000's | 649 | 312 | 1,029 | 652 | 682 | 963 | 6,248 | 570 | 402 | 287 |
| 2010's | 145 | 1,016 | 311 | 705 | 15 | 922 | 142 | 4,257 | 570 | 447 |
| 2020's | 1,012 | 358 |
| - = No Data Reported; -- = Not Applicable; NA = Not Available; W = Withheld to avoid disclosure of individual company data. |
| Release Date: 12/30/2022 |
| Next Release Date: NA |