|
Download Data (XLS File) |
|
|||||
|
|||||
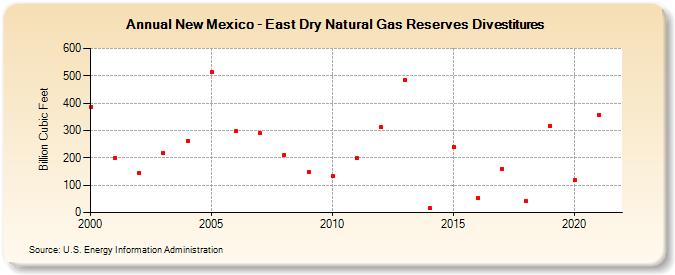
| New Mexico - East Dry Natural Gas Reserves Divestitures (Billion Cubic Feet) | |||||
| Decade | Year-0 | Year-1 | Year-2 | Year-3 | Year-4 | Year-5 | Year-6 | Year-7 | Year-8 | Year-9 |
|---|---|---|---|---|---|---|---|---|---|---|
| 2000's | 387 | 201 | 144 | 218 | 263 | 514 | 297 | 289 | 211 | 149 |
| 2010's | 133 | 199 | 311 | 483 | 15 | 240 | 54 | 161 | 43 | 318 |
| 2020's | 118 | 358 |
| - = No Data Reported; -- = Not Applicable; NA = Not Available; W = Withheld to avoid disclosure of individual company data. |
| Release Date: 12/30/2022 |
| Next Release Date: NA |