|
Download Data (XLS File) |
|
|||||
|
|||||
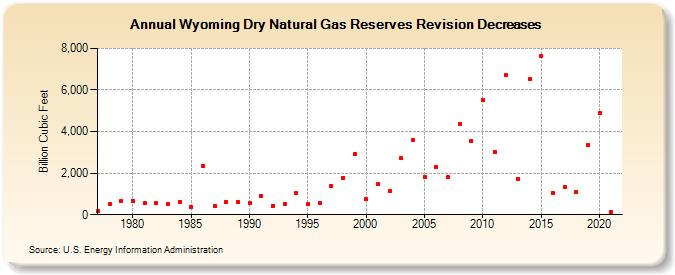
| Wyoming Dry Natural Gas Reserves Revision Decreases (Billion Cubic Feet) | |||||
| Decade | Year-0 | Year-1 | Year-2 | Year-3 | Year-4 | Year-5 | Year-6 | Year-7 | Year-8 | Year-9 |
|---|---|---|---|---|---|---|---|---|---|---|
| 1970's | 165 | 492 | 648 | |||||||
| 1980's | 683 | 541 | 546 | 503 | 634 | 391 | 2,354 | 425 | 617 | 619 |
| 1990's | 543 | 893 | 437 | 523 | 1,026 | 505 | 569 | 1,368 | 1,774 | 2,910 |
| 2000's | 753 | 1,488 | 1,161 | 2,704 | 3,586 | 1,822 | 2,281 | 1,818 | 4,383 | 3,535 |
| 2010's | 5,540 | 3,033 | 6,715 | 1,737 | 6,530 | 7,628 | 1,067 | 1,354 | 1,089 | 3,346 |
| 2020's | 4,869 | 125 |
| - = No Data Reported; -- = Not Applicable; NA = Not Available; W = Withheld to avoid disclosure of individual company data. |
| Release Date: 12/30/2022 |
| Next Release Date: NA |