|
Download Data (XLS File) |
|
|||||
|
|||||
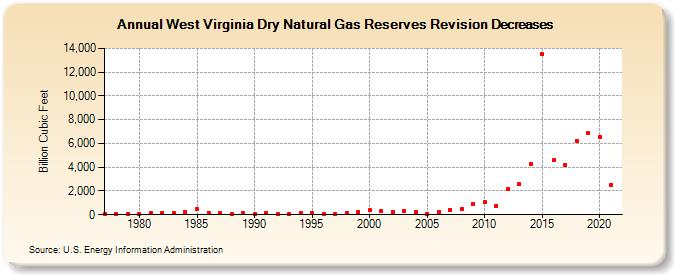
| West Virginia Dry Natural Gas Reserves Revision Decreases (Billion Cubic Feet) | |||||
| Decade | Year-0 | Year-1 | Year-2 | Year-3 | Year-4 | Year-5 | Year-6 | Year-7 | Year-8 | Year-9 |
|---|---|---|---|---|---|---|---|---|---|---|
| 1970's | 63 | 72 | 68 | |||||||
| 1980's | 100 | 108 | 184 | 104 | 198 | 471 | 177 | 134 | 95 | 140 |
| 1990's | 91 | 174 | 75 | 60 | 137 | 115 | 89 | 80 | 180 | 260 |
| 2000's | 390 | 279 | 250 | 306 | 256 | 76 | 188 | 359 | 444 | 865 |
| 2010's | 1,075 | 759 | 2,162 | 2,547 | 4,249 | 13,515 | 4,619 | 4,194 | 6,206 | 6,837 |
| 2020's | 6,562 | 2,521 |
| - = No Data Reported; -- = Not Applicable; NA = Not Available; W = Withheld to avoid disclosure of individual company data. |
| Release Date: 12/30/2022 |
| Next Release Date: NA |