|
Download Data (XLS File) |
|
|||||
|
|||||
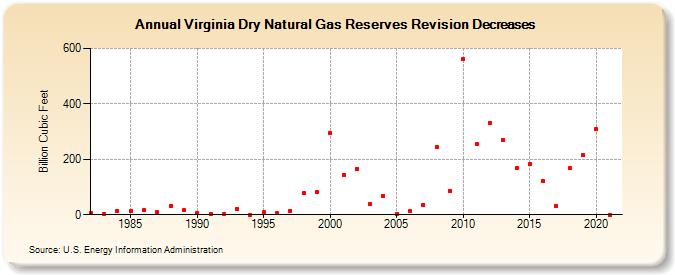
| Virginia Dry Natural Gas Reserves Revision Decreases (Billion Cubic Feet) | |||||
| Decade | Year-0 | Year-1 | Year-2 | Year-3 | Year-4 | Year-5 | Year-6 | Year-7 | Year-8 | Year-9 |
|---|---|---|---|---|---|---|---|---|---|---|
| 1980's | 7 | 3 | 15 | 15 | 16 | 8 | 32 | 17 | ||
| 1990's | 6 | 2 | 1 | 21 | 0 | 9 | 6 | 15 | 79 | 81 |
| 2000's | 295 | 145 | 166 | 37 | 69 | 3 | 14 | 36 | 246 | 87 |
| 2010's | 560 | 255 | 332 | 271 | 167 | 183 | 120 | 31 | 168 | 216 |
| 2020's | 308 | 0 |
| - = No Data Reported; -- = Not Applicable; NA = Not Available; W = Withheld to avoid disclosure of individual company data. |
| Release Date: 12/30/2022 |
| Next Release Date: NA |