|
Download Data (XLS File) |
|
|||||
|
|||||
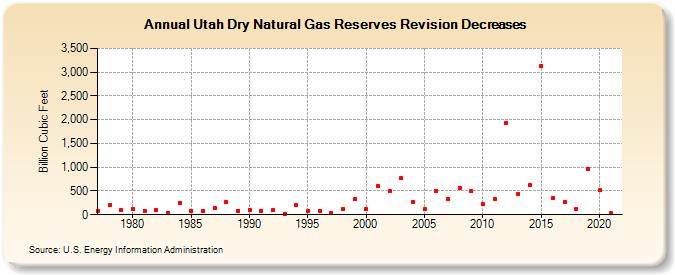
| Utah Dry Natural Gas Reserves Revision Decreases (Billion Cubic Feet) | |||||
| Decade | Year-0 | Year-1 | Year-2 | Year-3 | Year-4 | Year-5 | Year-6 | Year-7 | Year-8 | Year-9 |
|---|---|---|---|---|---|---|---|---|---|---|
| 1970's | 79 | 202 | 89 | |||||||
| 1980's | 123 | 84 | 99 | 42 | 257 | 83 | 78 | 144 | 277 | 84 |
| 1990's | 101 | 83 | 99 | 24 | 201 | 74 | 79 | 34 | 110 | 322 |
| 2000's | 110 | 606 | 490 | 767 | 278 | 112 | 502 | 325 | 564 | 491 |
| 2010's | 219 | 341 | 1,926 | 444 | 617 | 3,125 | 342 | 268 | 130 | 962 |
| 2020's | 519 | 28 |
| - = No Data Reported; -- = Not Applicable; NA = Not Available; W = Withheld to avoid disclosure of individual company data. |
| Release Date: 12/30/2022 |
| Next Release Date: NA |