|
Download Data (XLS File) |
|
|||||
|
|||||
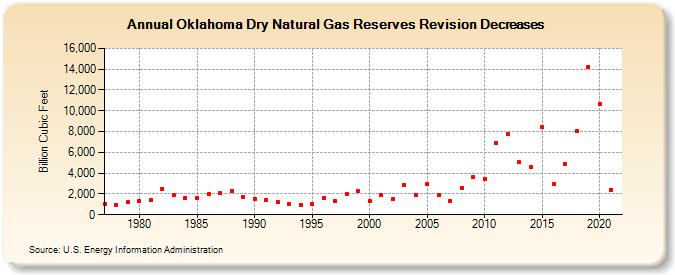
| Oklahoma Dry Natural Gas Reserves Revision Decreases (Billion Cubic Feet) | |||||
| Decade | Year-0 | Year-1 | Year-2 | Year-3 | Year-4 | Year-5 | Year-6 | Year-7 | Year-8 | Year-9 |
|---|---|---|---|---|---|---|---|---|---|---|
| 1970's | 1,016 | 969 | 1,211 | |||||||
| 1980's | 1,303 | 1,371 | 2,520 | 1,891 | 1,611 | 1,648 | 1,963 | 2,047 | 2,280 | 1,732 |
| 1990's | 1,542 | 1,456 | 1,263 | 1,008 | 932 | 1,049 | 1,602 | 1,282 | 1,997 | 2,251 |
| 2000's | 1,331 | 1,895 | 1,513 | 2,843 | 1,912 | 2,945 | 1,868 | 1,366 | 2,580 | 3,592 |
| 2010's | 3,474 | 6,856 | 7,731 | 5,031 | 4,585 | 8,391 | 2,981 | 4,843 | 8,021 | 14,237 |
| 2020's | 10,608 | 2,376 |
| - = No Data Reported; -- = Not Applicable; NA = Not Available; W = Withheld to avoid disclosure of individual company data. |
| Release Date: 12/30/2022 |
| Next Release Date: NA |