|
Download Data (XLS File) |
|
|||||
|
|||||
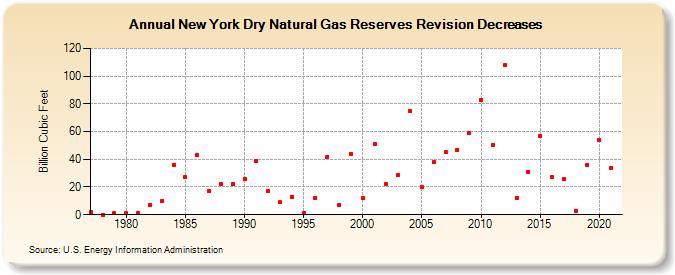
| New York Dry Natural Gas Reserves Revision Decreases (Billion Cubic Feet) | |||||
| Decade | Year-0 | Year-1 | Year-2 | Year-3 | Year-4 | Year-5 | Year-6 | Year-7 | Year-8 | Year-9 |
|---|---|---|---|---|---|---|---|---|---|---|
| 1970's | 2 | 0 | 1 | |||||||
| 1980's | 1 | 1 | 7 | 10 | 36 | 27 | 43 | 17 | 22 | 22 |
| 1990's | 26 | 39 | 17 | 9 | 13 | 1 | 12 | 42 | 7 | 44 |
| 2000's | 12 | 51 | 22 | 29 | 75 | 20 | 38 | 45 | 47 | 59 |
| 2010's | 83 | 50 | 108 | 12 | 31 | 57 | 27 | 26 | 3 | 36 |
| 2020's | 54 | 34 |
| - = No Data Reported; -- = Not Applicable; NA = Not Available; W = Withheld to avoid disclosure of individual company data. |
| Release Date: 12/30/2022 |
| Next Release Date: NA |