|
Download Data (XLS File) |
|
|||||
|
|||||
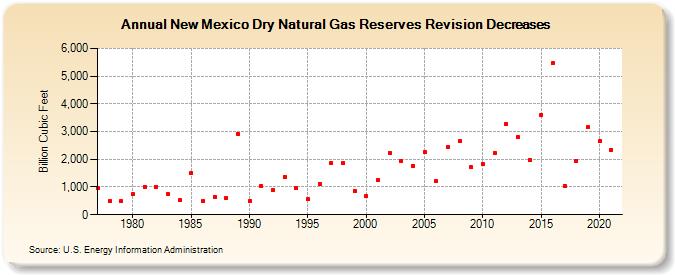
| New Mexico Dry Natural Gas Reserves Revision Decreases (Billion Cubic Feet) | |||||
| Decade | Year-0 | Year-1 | Year-2 | Year-3 | Year-4 | Year-5 | Year-6 | Year-7 | Year-8 | Year-9 |
|---|---|---|---|---|---|---|---|---|---|---|
| 1970's | 952 | 491 | 490 | |||||||
| 1980's | 734 | 1,012 | 1,013 | 753 | 517 | 1,487 | 491 | 650 | 613 | 2,914 |
| 1990's | 491 | 1,043 | 898 | 1,377 | 956 | 551 | 1,115 | 1,868 | 1,882 | 864 |
| 2000's | 684 | 1,244 | 2,239 | 1,941 | 1,771 | 2,269 | 1,203 | 2,431 | 2,657 | 1,708 |
| 2010's | 1,833 | 2,229 | 3,276 | 2,791 | 1,979 | 3,599 | 5,465 | 1,046 | 1,951 | 3,147 |
| 2020's | 2,659 | 2,345 |
| - = No Data Reported; -- = Not Applicable; NA = Not Available; W = Withheld to avoid disclosure of individual company data. |
| Release Date: 12/30/2022 |
| Next Release Date: NA |