|
Download Data (XLS File) |
|
|||||
|
|||||
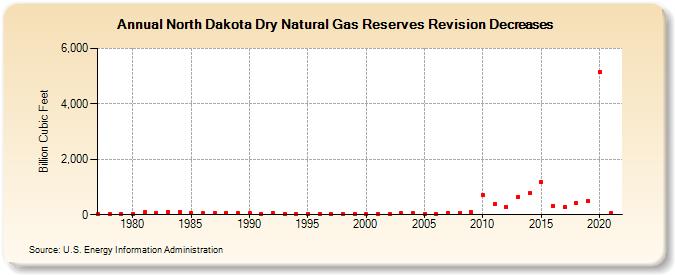
| North Dakota Dry Natural Gas Reserves Revision Decreases (Billion Cubic Feet) | |||||
| Decade | Year-0 | Year-1 | Year-2 | Year-3 | Year-4 | Year-5 | Year-6 | Year-7 | Year-8 | Year-9 |
|---|---|---|---|---|---|---|---|---|---|---|
| 1970's | 10 | 18 | 14 | |||||||
| 1980's | 18 | 85 | 56 | 113 | 96 | 46 | 51 | 64 | 78 | 52 |
| 1990's | 50 | 33 | 57 | 27 | 24 | 29 | 22 | 17 | 27 | 31 |
| 2000's | 15 | 32 | 20 | 44 | 57 | 27 | 31 | 62 | 75 | 81 |
| 2010's | 722 | 375 | 292 | 640 | 777 | 1,164 | 329 | 271 | 409 | 510 |
| 2020's | 5,156 | 78 |
| - = No Data Reported; -- = Not Applicable; NA = Not Available; W = Withheld to avoid disclosure of individual company data. |
| Release Date: 12/30/2022 |
| Next Release Date: NA |