|
Download Data (XLS File) |
|
|||||
|
|||||
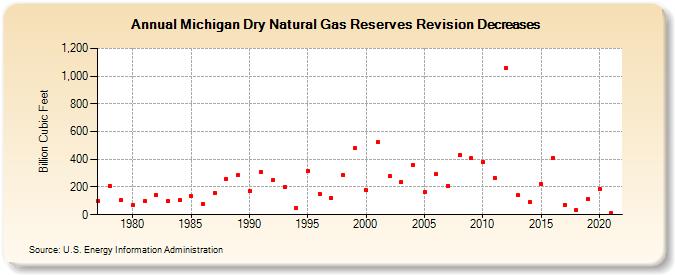
| Michigan Dry Natural Gas Reserves Revision Decreases (Billion Cubic Feet) | |||||
| Decade | Year-0 | Year-1 | Year-2 | Year-3 | Year-4 | Year-5 | Year-6 | Year-7 | Year-8 | Year-9 |
|---|---|---|---|---|---|---|---|---|---|---|
| 1970's | 99 | 209 | 106 | |||||||
| 1980's | 71 | 98 | 144 | 100 | 105 | 132 | 78 | 157 | 261 | 283 |
| 1990's | 170 | 311 | 248 | 202 | 48 | 315 | 152 | 124 | 288 | 478 |
| 2000's | 176 | 524 | 276 | 235 | 360 | 163 | 291 | 210 | 430 | 406 |
| 2010's | 378 | 267 | 1,062 | 139 | 90 | 221 | 410 | 73 | 34 | 110 |
| 2020's | 187 | 12 |
| - = No Data Reported; -- = Not Applicable; NA = Not Available; W = Withheld to avoid disclosure of individual company data. |
| Release Date: 12/30/2022 |
| Next Release Date: NA |