|
Download Data (XLS File) |
|
|||||
|
|||||
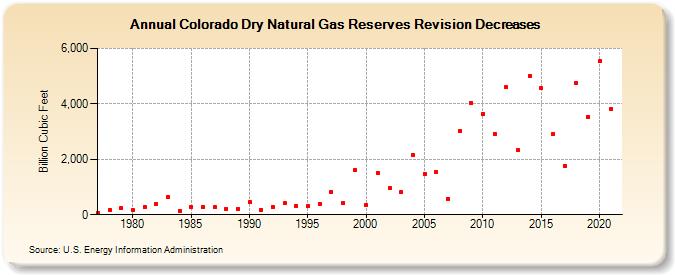
| Colorado Dry Natural Gas Reserves Revision Decreases (Billion Cubic Feet) | |||||
| Decade | Year-0 | Year-1 | Year-2 | Year-3 | Year-4 | Year-5 | Year-6 | Year-7 | Year-8 | Year-9 |
|---|---|---|---|---|---|---|---|---|---|---|
| 1970's | 77 | 165 | 235 | |||||||
| 1980's | 177 | 282 | 370 | 636 | 152 | 289 | 277 | 268 | 216 | 217 |
| 1990's | 455 | 180 | 288 | 411 | 328 | 313 | 398 | 826 | 437 | 1,607 |
| 2000's | 360 | 1,513 | 962 | 812 | 2,167 | 1,478 | 1,524 | 582 | 3,029 | 4,044 |
| 2010's | 3,645 | 2,921 | 4,598 | 2,329 | 5,007 | 4,555 | 2,912 | 1,769 | 4,743 | 3,538 |
| 2020's | 5,542 | 3,825 |
| - = No Data Reported; -- = Not Applicable; NA = Not Available; W = Withheld to avoid disclosure of individual company data. |
| Release Date: 12/30/2022 |
| Next Release Date: NA |