|
Download Data (XLS File) |
|
|||||
|
|||||
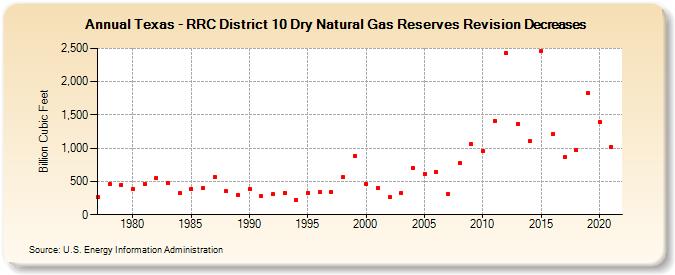
| Texas - RRC District 10 Dry Natural Gas Reserves Revision Decreases (Billion Cubic Feet) | |||||
| Decade | Year-0 | Year-1 | Year-2 | Year-3 | Year-4 | Year-5 | Year-6 | Year-7 | Year-8 | Year-9 |
|---|---|---|---|---|---|---|---|---|---|---|
| 1970's | 264 | 463 | 449 | |||||||
| 1980's | 390 | 466 | 547 | 471 | 319 | 390 | 396 | 572 | 352 | 300 |
| 1990's | 386 | 276 | 304 | 333 | 224 | 331 | 335 | 340 | 560 | 888 |
| 2000's | 467 | 404 | 262 | 333 | 705 | 616 | 639 | 315 | 781 | 1,060 |
| 2010's | 958 | 1,413 | 2,427 | 1,369 | 1,101 | 2,461 | 1,214 | 865 | 969 | 1,828 |
| 2020's | 1,398 | 1,023 |
| - = No Data Reported; -- = Not Applicable; NA = Not Available; W = Withheld to avoid disclosure of individual company data. |
| Release Date: 12/30/2022 |
| Next Release Date: NA |