|
Download Data (XLS File) |
|
|||||
|
|||||
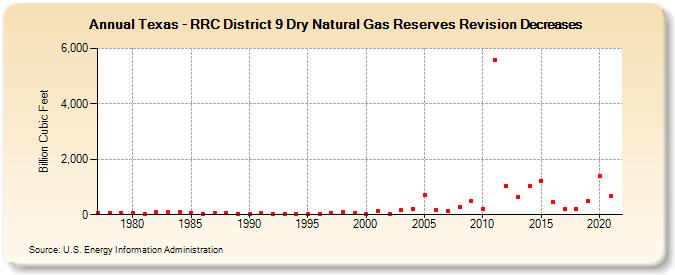
| Texas - RRC District 9 Dry Natural Gas Reserves Revision Decreases (Billion Cubic Feet) | |||||
| Decade | Year-0 | Year-1 | Year-2 | Year-3 | Year-4 | Year-5 | Year-6 | Year-7 | Year-8 | Year-9 |
|---|---|---|---|---|---|---|---|---|---|---|
| 1970's | 52 | 64 | 54 | |||||||
| 1980's | 48 | 37 | 115 | 91 | 95 | 72 | 43 | 68 | 49 | 19 |
| 1990's | 35 | 46 | 37 | 43 | 17 | 16 | 25 | 74 | 80 | 64 |
| 2000's | 21 | 127 | 43 | 154 | 210 | 702 | 183 | 118 | 285 | 503 |
| 2010's | 221 | 5,564 | 1,048 | 636 | 1,036 | 1,227 | 455 | 190 | 212 | 498 |
| 2020's | 1,400 | 666 |
| - = No Data Reported; -- = Not Applicable; NA = Not Available; W = Withheld to avoid disclosure of individual company data. |
| Release Date: 12/30/2022 |
| Next Release Date: NA |