|
Download Data (XLS File) |
|
|||||
|
|||||
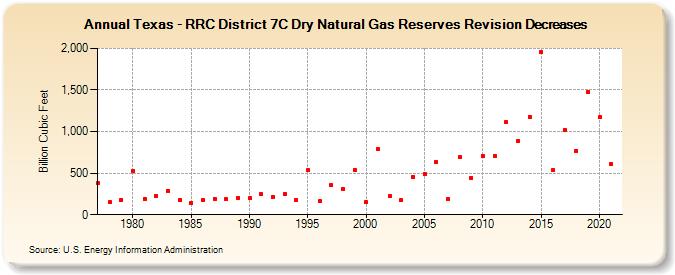
| Texas - RRC District 7C Dry Natural Gas Reserves Revision Decreases (Billion Cubic Feet) | |||||
| Decade | Year-0 | Year-1 | Year-2 | Year-3 | Year-4 | Year-5 | Year-6 | Year-7 | Year-8 | Year-9 |
|---|---|---|---|---|---|---|---|---|---|---|
| 1970's | 383 | 149 | 180 | |||||||
| 1980's | 530 | 190 | 230 | 291 | 178 | 144 | 174 | 192 | 184 | 206 |
| 1990's | 197 | 245 | 213 | 250 | 175 | 535 | 159 | 356 | 304 | 542 |
| 2000's | 150 | 790 | 224 | 173 | 458 | 487 | 634 | 185 | 690 | 447 |
| 2010's | 710 | 708 | 1,113 | 889 | 1,177 | 1,954 | 543 | 1,020 | 767 | 1,474 |
| 2020's | 1,170 | 608 |
| - = No Data Reported; -- = Not Applicable; NA = Not Available; W = Withheld to avoid disclosure of individual company data. |
| Release Date: 12/30/2022 |
| Next Release Date: NA |