|
Download Data (XLS File) |
|
|||||
|
|||||
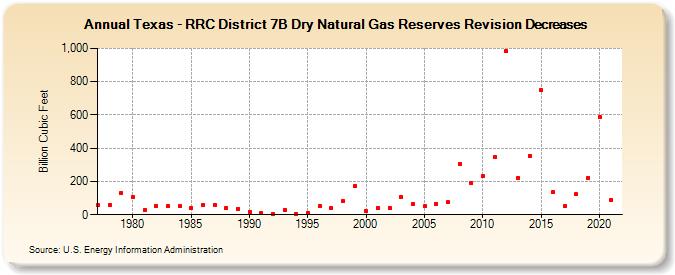
| Texas - RRC District 7B Dry Natural Gas Reserves Revision Decreases (Billion Cubic Feet) | |||||
| Decade | Year-0 | Year-1 | Year-2 | Year-3 | Year-4 | Year-5 | Year-6 | Year-7 | Year-8 | Year-9 |
|---|---|---|---|---|---|---|---|---|---|---|
| 1970's | 58 | 59 | 133 | |||||||
| 1980's | 107 | 29 | 51 | 50 | 50 | 42 | 59 | 58 | 41 | 36 |
| 1990's | 19 | 12 | 6 | 29 | 7 | 11 | 51 | 40 | 81 | 171 |
| 2000's | 21 | 42 | 42 | 104 | 64 | 50 | 67 | 74 | 307 | 193 |
| 2010's | 231 | 344 | 983 | 223 | 355 | 747 | 135 | 50 | 122 | 223 |
| 2020's | 588 | 90 |
| - = No Data Reported; -- = Not Applicable; NA = Not Available; W = Withheld to avoid disclosure of individual company data. |
| Release Date: 12/30/2022 |
| Next Release Date: NA |