|
Download Data (XLS File) |
|
|||||
|
|||||
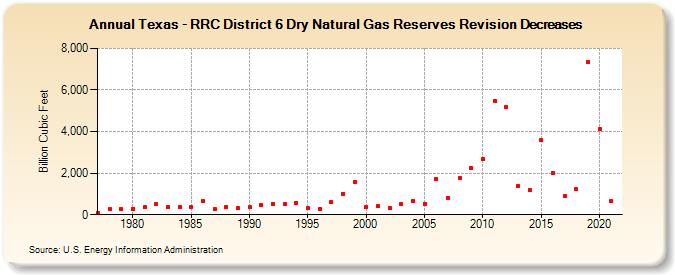
| Texas - RRC District 6 Dry Natural Gas Reserves Revision Decreases (Billion Cubic Feet) | |||||
| Decade | Year-0 | Year-1 | Year-2 | Year-3 | Year-4 | Year-5 | Year-6 | Year-7 | Year-8 | Year-9 |
|---|---|---|---|---|---|---|---|---|---|---|
| 1970's | 95 | 284 | 292 | |||||||
| 1980's | 298 | 365 | 500 | 362 | 369 | 369 | 648 | 269 | 375 | 303 |
| 1990's | 357 | 457 | 533 | 496 | 574 | 337 | 272 | 592 | 1,019 | 1,581 |
| 2000's | 367 | 419 | 342 | 496 | 663 | 538 | 1,741 | 827 | 1,770 | 2,225 |
| 2010's | 2,680 | 5,464 | 5,203 | 1,404 | 1,178 | 3,581 | 1,996 | 877 | 1,216 | 7,341 |
| 2020's | 4,107 | 647 |
| - = No Data Reported; -- = Not Applicable; NA = Not Available; W = Withheld to avoid disclosure of individual company data. |
| Release Date: 12/30/2022 |
| Next Release Date: NA |