|
Download Data (XLS File) |
|
|||||
|
|||||
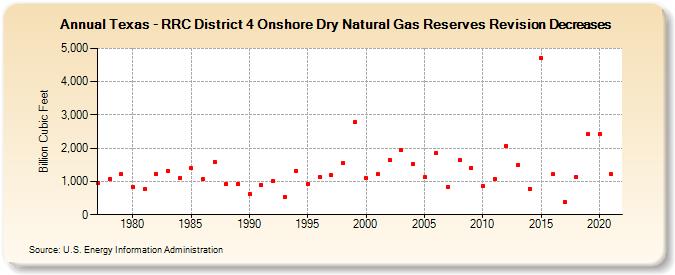
| Texas - RRC District 4 Onshore Dry Natural Gas Reserves Revision Decreases (Billion Cubic Feet) | |||||
| Decade | Year-0 | Year-1 | Year-2 | Year-3 | Year-4 | Year-5 | Year-6 | Year-7 | Year-8 | Year-9 |
|---|---|---|---|---|---|---|---|---|---|---|
| 1970's | 962 | 1,067 | 1,218 | |||||||
| 1980's | 836 | 761 | 1,234 | 1,317 | 1,096 | 1,400 | 1,062 | 1,599 | 920 | 935 |
| 1990's | 621 | 896 | 1,001 | 535 | 1,323 | 929 | 1,139 | 1,179 | 1,562 | 2,777 |
| 2000's | 1,095 | 1,211 | 1,655 | 1,936 | 1,531 | 1,120 | 1,857 | 840 | 1,638 | 1,419 |
| 2010's | 850 | 1,087 | 2,072 | 1,491 | 786 | 4,720 | 1,214 | 396 | 1,139 | 2,418 |
| 2020's | 2,419 | 1,215 |
| - = No Data Reported; -- = Not Applicable; NA = Not Available; W = Withheld to avoid disclosure of individual company data. |
| Release Date: 12/30/2022 |
| Next Release Date: NA |