|
Download Data (XLS File) |
|
|||||
|
|||||
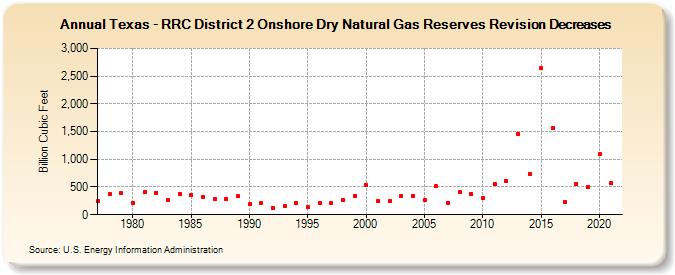
| Texas - RRC District 2 Onshore Dry Natural Gas Reserves Revision Decreases (Billion Cubic Feet) | |||||
| Decade | Year-0 | Year-1 | Year-2 | Year-3 | Year-4 | Year-5 | Year-6 | Year-7 | Year-8 | Year-9 |
|---|---|---|---|---|---|---|---|---|---|---|
| 1970's | 245 | 372 | 387 | |||||||
| 1980's | 207 | 409 | 397 | 268 | 373 | 354 | 323 | 280 | 285 | 337 |
| 1990's | 186 | 213 | 129 | 149 | 205 | 143 | 210 | 209 | 257 | 339 |
| 2000's | 533 | 246 | 245 | 333 | 343 | 260 | 511 | 218 | 414 | 372 |
| 2010's | 302 | 550 | 614 | 1,462 | 732 | 2,638 | 1,568 | 227 | 558 | 503 |
| 2020's | 1,096 | 567 |
| - = No Data Reported; -- = Not Applicable; NA = Not Available; W = Withheld to avoid disclosure of individual company data. |
| Release Date: 12/30/2022 |
| Next Release Date: NA |