|
Download Data (XLS File) |
|
|||||
|
|||||
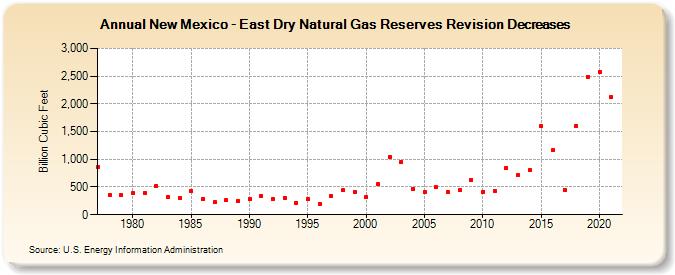
| New Mexico - East Dry Natural Gas Reserves Revision Decreases (Billion Cubic Feet) | |||||
| Decade | Year-0 | Year-1 | Year-2 | Year-3 | Year-4 | Year-5 | Year-6 | Year-7 | Year-8 | Year-9 |
|---|---|---|---|---|---|---|---|---|---|---|
| 1970's | 868 | 361 | 355 | |||||||
| 1980's | 391 | 392 | 521 | 315 | 300 | 430 | 284 | 222 | 259 | 250 |
| 1990's | 283 | 336 | 287 | 309 | 218 | 279 | 191 | 334 | 439 | 411 |
| 2000's | 322 | 548 | 1,047 | 950 | 467 | 412 | 495 | 413 | 441 | 628 |
| 2010's | 418 | 431 | 850 | 715 | 805 | 1,592 | 1,166 | 449 | 1,608 | 2,490 |
| 2020's | 2,568 | 2,120 |
| - = No Data Reported; -- = Not Applicable; NA = Not Available; W = Withheld to avoid disclosure of individual company data. |
| Release Date: 12/30/2022 |
| Next Release Date: NA |