|
Download Data (XLS File) |
|
|||||
|
|||||
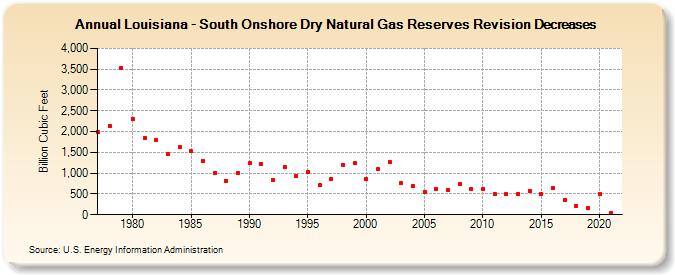
| Louisiana - South Onshore Dry Natural Gas Reserves Revision Decreases (Billion Cubic Feet) | |||||
| Decade | Year-0 | Year-1 | Year-2 | Year-3 | Year-4 | Year-5 | Year-6 | Year-7 | Year-8 | Year-9 |
|---|---|---|---|---|---|---|---|---|---|---|
| 1970's | 1,980 | 2,142 | 3,531 | |||||||
| 1980's | 2,308 | 1,853 | 1,795 | 1,450 | 1,635 | 1,524 | 1,287 | 1,005 | 817 | 1,007 |
| 1990's | 1,233 | 1,224 | 835 | 1,159 | 930 | 1,028 | 705 | 859 | 1,199 | 1,238 |
| 2000's | 852 | 1,091 | 1,278 | 755 | 681 | 554 | 607 | 587 | 738 | 610 |
| 2010's | 615 | 504 | 491 | 502 | 568 | 500 | 638 | 360 | 220 | 173 |
| 2020's | 503 | 47 |
| - = No Data Reported; -- = Not Applicable; NA = Not Available; W = Withheld to avoid disclosure of individual company data. |
| Release Date: 12/30/2022 |
| Next Release Date: NA |