|
Download Data (XLS File) |
|
|||||
|
|||||
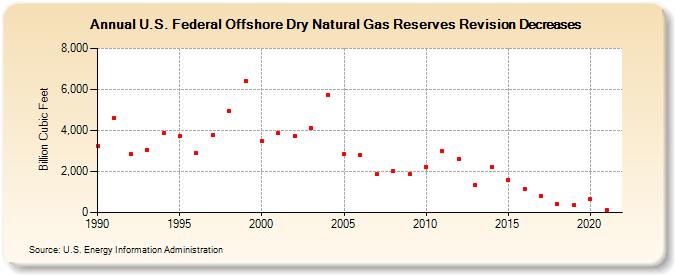
| U.S. Federal Offshore Dry Natural Gas Reserves Revision Decreases (Billion Cubic Feet) | |||||
| Decade | Year-0 | Year-1 | Year-2 | Year-3 | Year-4 | Year-5 | Year-6 | Year-7 | Year-8 | Year-9 |
|---|---|---|---|---|---|---|---|---|---|---|
| 1990's | 3,227 | 4,612 | 2,849 | 3,064 | 3,853 | 3,725 | 2,912 | 3,803 | 4,966 | 6,405 |
| 2000's | 3,495 | 3,856 | 3,744 | 4,106 | 5,734 | 2,878 | 2,798 | 1,864 | 2,017 | 1,871 |
| 2010's | 2,242 | 2,993 | 2,611 | 1,328 | 2,244 | 1,603 | 1,159 | 820 | 424 | 351 |
| 2020's | 639 | 108 |
| - = No Data Reported; -- = Not Applicable; NA = Not Available; W = Withheld to avoid disclosure of individual company data. |
| Release Date: 12/30/2022 |
| Next Release Date: NA |