|
Download Data (XLS File) |
|
|||||
|
|||||
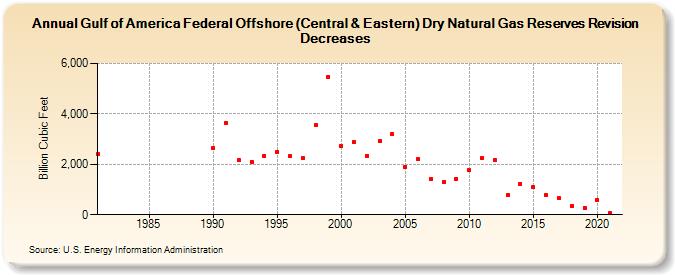
| Gulf of America Federal Offshore (Central & Eastern) Dry Natural Gas Reserves Revision Decreases (Billion Cubic Feet) | |||||
| Decade | Year-0 | Year-1 | Year-2 | Year-3 | Year-4 | Year-5 | Year-6 | Year-7 | Year-8 | Year-9 |
|---|---|---|---|---|---|---|---|---|---|---|
| 1980's | 2,421 | |||||||||
| 1990's | 2,634 | 3,643 | 2,167 | 2,102 | 2,334 | 2,488 | 2,317 | 2,250 | 3,543 | 5,480 |
| 2000's | 2,746 | 2,877 | 2,343 | 2,922 | 3,201 | 1,903 | 2,201 | 1,429 | 1,312 | 1,417 |
| 2010's | 1,771 | 2,260 | 2,178 | 789 | 1,234 | 1,099 | 786 | 657 | 363 | 278 |
| 2020's | 564 | 65 |
| - = No Data Reported; -- = Not Applicable; NA = Not Available; W = Withheld to avoid disclosure of individual company data. |
| Release Date: 12/30/2022 |
| Next Release Date: NA |