|
Download Data (XLS File) |
|
|||||
|
|||||
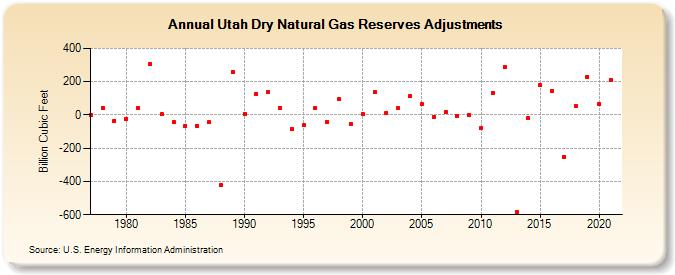
| Utah Dry Natural Gas Reserves Adjustments (Billion Cubic Feet) | |||||
| Decade | Year-0 | Year-1 | Year-2 | Year-3 | Year-4 | Year-5 | Year-6 | Year-7 | Year-8 | Year-9 |
|---|---|---|---|---|---|---|---|---|---|---|
| 1970's | 0 | 44 | -35 | |||||||
| 1980's | -22 | 44 | 307 | 4 | -44 | -65 | -68 | -45 | -424 | 260 |
| 1990's | 8 | 126 | 136 | 43 | -82 | -63 | 44 | -40 | 97 | -56 |
| 2000's | 4 | 135 | 13 | 40 | 113 | 65 | -11 | 17 | -4 | 1 |
| 2010's | -80 | 134 | 289 | -582 | -20 | 177 | 144 | -251 | 56 | 230 |
| 2020's | 66 | 211 |
| - = No Data Reported; -- = Not Applicable; NA = Not Available; W = Withheld to avoid disclosure of individual company data. |
| Release Date: 12/30/2022 |
| Next Release Date: NA |