|
Download Data (XLS File) |
|
|||||
|
|||||
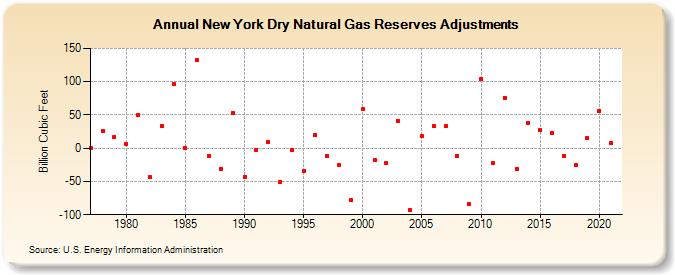
| New York Dry Natural Gas Reserves Adjustments (Billion Cubic Feet) | |||||
| Decade | Year-0 | Year-1 | Year-2 | Year-3 | Year-4 | Year-5 | Year-6 | Year-7 | Year-8 | Year-9 |
|---|---|---|---|---|---|---|---|---|---|---|
| 1970's | 0 | 26 | 17 | |||||||
| 1980's | 7 | 50 | -43 | 33 | 96 | 0 | 133 | -11 | -31 | 53 |
| 1990's | -43 | -2 | 9 | -51 | -3 | -35 | 20 | -12 | -26 | -78 |
| 2000's | 59 | -18 | -23 | 41 | -93 | 18 | 33 | 33 | -11 | -84 |
| 2010's | 104 | -22 | 76 | -32 | 38 | 27 | 23 | -11 | -25 | 15 |
| 2020's | 56 | 8 |
| - = No Data Reported; -- = Not Applicable; NA = Not Available; W = Withheld to avoid disclosure of individual company data. |
| Release Date: 12/30/2022 |
| Next Release Date: NA |