|
Download Data (XLS File) |
|
|||||
|
|||||
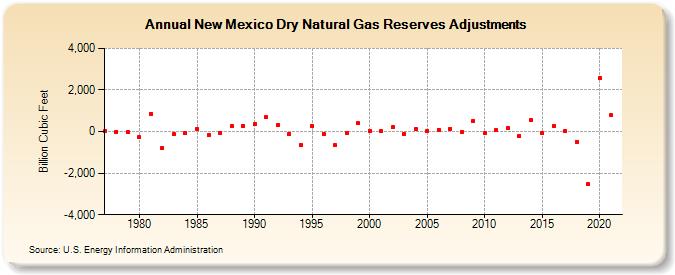
| New Mexico Dry Natural Gas Reserves Adjustments (Billion Cubic Feet) | |||||
| Decade | Year-0 | Year-1 | Year-2 | Year-3 | Year-4 | Year-5 | Year-6 | Year-7 | Year-8 | Year-9 |
|---|---|---|---|---|---|---|---|---|---|---|
| 1970's | 13 | -20 | -37 | |||||||
| 1980's | -282 | 866 | -779 | -135 | -78 | 131 | -176 | -76 | 249 | 255 |
| 1990's | 342 | 683 | 313 | -124 | -641 | 284 | -106 | -664 | -48 | 394 |
| 2000's | 18 | 9 | 199 | -104 | 126 | 44 | 91 | 136 | -6 | 525 |
| 2010's | -89 | 73 | 153 | -202 | 555 | -61 | 288 | 28 | -488 | -2,535 |
| 2020's | 2,568 | 796 |
| - = No Data Reported; -- = Not Applicable; NA = Not Available; W = Withheld to avoid disclosure of individual company data. |
| Release Date: 12/30/2022 |
| Next Release Date: NA |