|
Download Data (XLS File) |
|
|||||
|
|||||
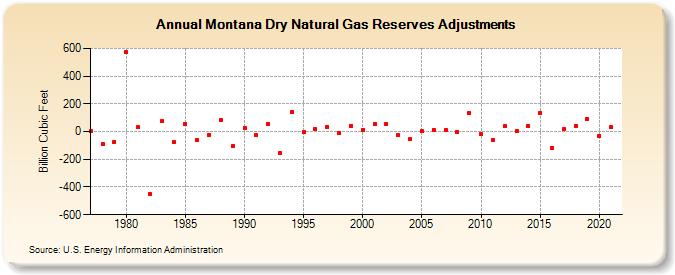
| Montana Dry Natural Gas Reserves Adjustments (Billion Cubic Feet) | |||||
| Decade | Year-0 | Year-1 | Year-2 | Year-3 | Year-4 | Year-5 | Year-6 | Year-7 | Year-8 | Year-9 |
|---|---|---|---|---|---|---|---|---|---|---|
| 1970's | 1 | -91 | -74 | |||||||
| 1980's | 573 | 30 | -448 | 75 | -74 | 56 | -61 | -25 | 83 | -106 |
| 1990's | 29 | -27 | 58 | -154 | 142 | -4 | 16 | 33 | -12 | 42 |
| 2000's | 13 | 51 | 58 | -28 | -56 | 3 | 13 | 9 | -3 | 135 |
| 2010's | -19 | -59 | 38 | 3 | 39 | 137 | -116 | 18 | 43 | 90 |
| 2020's | -29 | 30 |
| - = No Data Reported; -- = Not Applicable; NA = Not Available; W = Withheld to avoid disclosure of individual company data. |
| Release Date: 12/30/2022 |
| Next Release Date: NA |