|
Download Data (XLS File) |
|
|||||
|
|||||
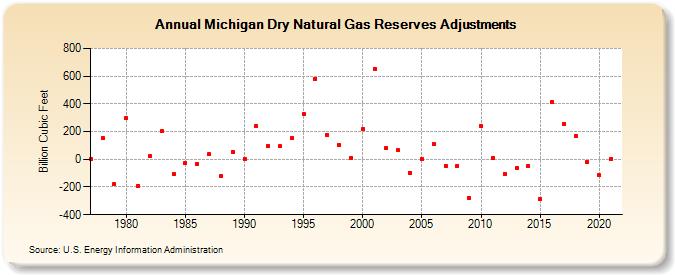
| Michigan Dry Natural Gas Reserves Adjustments (Billion Cubic Feet) | |||||
| Decade | Year-0 | Year-1 | Year-2 | Year-3 | Year-4 | Year-5 | Year-6 | Year-7 | Year-8 | Year-9 |
|---|---|---|---|---|---|---|---|---|---|---|
| 1970's | -1 | 153 | -182 | |||||||
| 1980's | 297 | -191 | 23 | 205 | -106 | -26 | -32 | 35 | -124 | 55 |
| 1990's | 3 | 240 | 95 | 94 | 155 | 327 | 581 | 177 | 105 | 12 |
| 2000's | 217 | 653 | 82 | 65 | -97 | 1 | 112 | -45 | -48 | -279 |
| 2010's | 243 | 8 | -104 | -62 | -47 | -286 | 413 | 255 | 171 | -17 |
| 2020's | -116 | 5 |
| - = No Data Reported; -- = Not Applicable; NA = Not Available; W = Withheld to avoid disclosure of individual company data. |
| Release Date: 12/30/2022 |
| Next Release Date: NA |