|
Download Data (XLS File) |
|
|||||
|
|||||
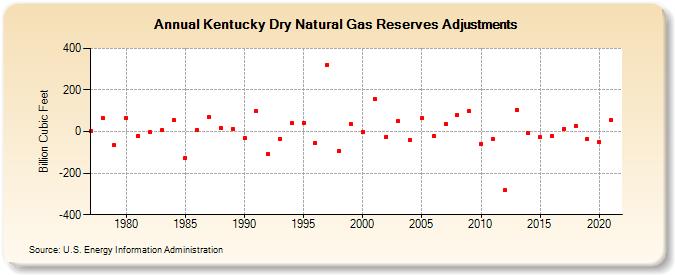
| Kentucky Dry Natural Gas Reserves Adjustments (Billion Cubic Feet) | |||||
| Decade | Year-0 | Year-1 | Year-2 | Year-3 | Year-4 | Year-5 | Year-6 | Year-7 | Year-8 | Year-9 |
|---|---|---|---|---|---|---|---|---|---|---|
| 1970's | 1 | 64 | -66 | |||||||
| 1980's | 67 | -20 | -4 | 6 | 55 | -126 | 7 | 68 | 16 | 14 |
| 1990's | -31 | 97 | -107 | -34 | 40 | 43 | -55 | 321 | -93 | 34 |
| 2000's | -4 | 158 | -24 | 49 | -40 | 65 | -22 | 37 | 81 | 97 |
| 2010's | -58 | -34 | -282 | 103 | -9 | -27 | -20 | 14 | 28 | -34 |
| 2020's | -48 | 55 |
| - = No Data Reported; -- = Not Applicable; NA = Not Available; W = Withheld to avoid disclosure of individual company data. |
| Release Date: 12/30/2022 |
| Next Release Date: NA |