|
Download Data (XLS File) |
|
|||||
|
|||||
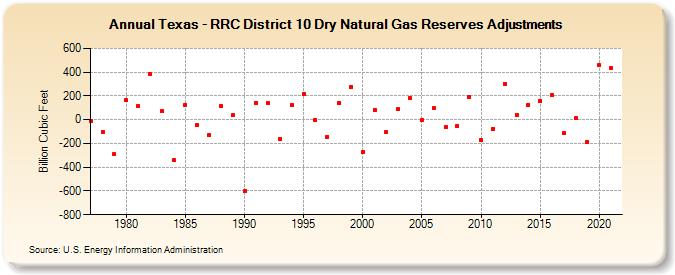
| Texas - RRC District 10 Dry Natural Gas Reserves Adjustments (Billion Cubic Feet) | |||||
| Decade | Year-0 | Year-1 | Year-2 | Year-3 | Year-4 | Year-5 | Year-6 | Year-7 | Year-8 | Year-9 |
|---|---|---|---|---|---|---|---|---|---|---|
| 1970's | -9 | -102 | -293 | |||||||
| 1980's | 162 | 117 | 381 | 71 | -342 | 124 | -45 | -129 | 111 | 38 |
| 1990's | -602 | 138 | 137 | -159 | 125 | 212 | -4 | -142 | 141 | 279 |
| 2000's | -273 | 82 | -106 | 87 | 184 | -2 | 95 | -61 | -55 | 188 |
| 2010's | -172 | -76 | 301 | 41 | 127 | 161 | 206 | -114 | 10 | -187 |
| 2020's | 459 | 432 |
| - = No Data Reported; -- = Not Applicable; NA = Not Available; W = Withheld to avoid disclosure of individual company data. |
| Release Date: 12/30/2022 |
| Next Release Date: NA |