|
Download Data (XLS File) |
|
|||||
|
|||||
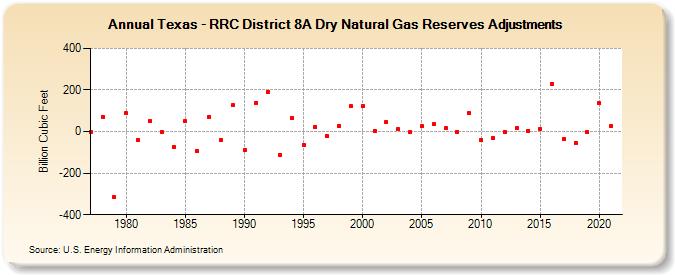
| Texas - RRC District 8A Dry Natural Gas Reserves Adjustments (Billion Cubic Feet) | |||||
| Decade | Year-0 | Year-1 | Year-2 | Year-3 | Year-4 | Year-5 | Year-6 | Year-7 | Year-8 | Year-9 |
|---|---|---|---|---|---|---|---|---|---|---|
| 1970's | 0 | 71 | -315 | |||||||
| 1980's | 87 | -39 | 50 | -1 | -73 | 49 | -94 | 72 | -40 | 126 |
| 1990's | -89 | 139 | 191 | -111 | 66 | -63 | 22 | -22 | 29 | 121 |
| 2000's | 122 | 5 | 46 | 10 | -4 | 25 | 34 | 15 | 0 | 87 |
| 2010's | -40 | -30 | -2 | 16 | 4 | 13 | 230 | -35 | -54 | -3 |
| 2020's | 137 | 25 |
| - = No Data Reported; -- = Not Applicable; NA = Not Available; W = Withheld to avoid disclosure of individual company data. |
| Release Date: 12/30/2022 |
| Next Release Date: NA |