|
Download Data (XLS File) |
|
|||||
|
|||||
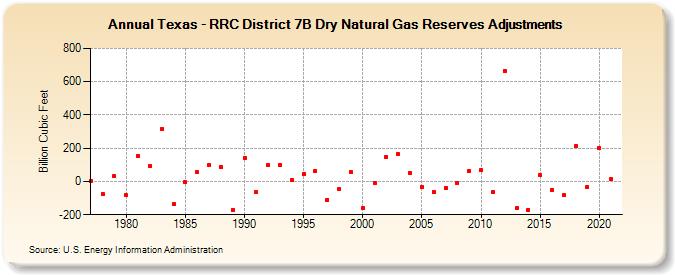
| Texas - RRC District 7B Dry Natural Gas Reserves Adjustments (Billion Cubic Feet) | |||||
| Decade | Year-0 | Year-1 | Year-2 | Year-3 | Year-4 | Year-5 | Year-6 | Year-7 | Year-8 | Year-9 |
|---|---|---|---|---|---|---|---|---|---|---|
| 1970's | 2 | -76 | 32 | |||||||
| 1980's | -84 | 155 | 93 | 317 | -137 | -5 | 54 | 96 | 87 | -169 |
| 1990's | 143 | -66 | 97 | 101 | 7 | 46 | 63 | -110 | -47 | 55 |
| 2000's | -160 | -7 | 147 | 165 | 52 | -33 | -61 | -38 | -12 | 63 |
| 2010's | 68 | -65 | 666 | -162 | -170 | 38 | -49 | -82 | 213 | -32 |
| 2020's | 200 | 13 |
| - = No Data Reported; -- = Not Applicable; NA = Not Available; W = Withheld to avoid disclosure of individual company data. |
| Release Date: 12/30/2022 |
| Next Release Date: NA |