|
Download Data (XLS File) |
|
|||||
|
|||||
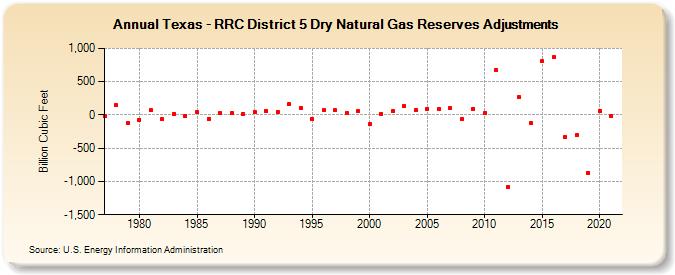
| Texas - RRC District 5 Dry Natural Gas Reserves Adjustments (Billion Cubic Feet) | |||||
| Decade | Year-0 | Year-1 | Year-2 | Year-3 | Year-4 | Year-5 | Year-6 | Year-7 | Year-8 | Year-9 |
|---|---|---|---|---|---|---|---|---|---|---|
| 1970's | -22 | 144 | -126 | |||||||
| 1980's | -70 | 68 | -66 | 18 | -13 | 39 | -55 | 31 | 23 | 21 |
| 1990's | 44 | 66 | 51 | 159 | 103 | -62 | 69 | 68 | 29 | 52 |
| 2000's | -138 | 15 | 57 | 130 | 68 | 93 | 84 | 97 | -61 | 96 |
| 2010's | 27 | 674 | -1,078 | 269 | -119 | 803 | 868 | -339 | -301 | -868 |
| 2020's | 56 | -14 |
| - = No Data Reported; -- = Not Applicable; NA = Not Available; W = Withheld to avoid disclosure of individual company data. |
| Release Date: 12/30/2022 |
| Next Release Date: NA |