|
Download Data (XLS File) |
|
|||||
|
|||||
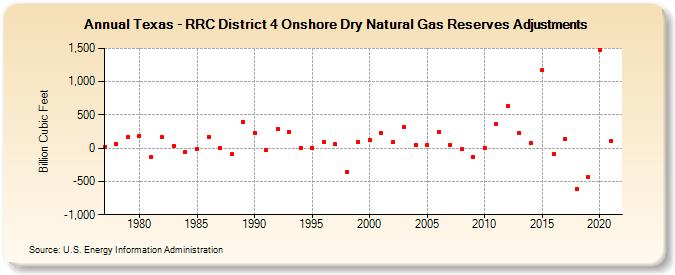
| Texas - RRC District 4 Onshore Dry Natural Gas Reserves Adjustments (Billion Cubic Feet) | |||||
| Decade | Year-0 | Year-1 | Year-2 | Year-3 | Year-4 | Year-5 | Year-6 | Year-7 | Year-8 | Year-9 |
|---|---|---|---|---|---|---|---|---|---|---|
| 1970's | 24 | 61 | 164 | |||||||
| 1980's | 188 | -139 | 161 | 31 | -58 | -5 | 172 | 5 | -84 | 401 |
| 1990's | 235 | -29 | 294 | 249 | 9 | 9 | 94 | 57 | -353 | 94 |
| 2000's | 122 | 228 | 91 | 325 | 43 | 55 | 250 | 53 | -19 | -127 |
| 2010's | 3 | 358 | 635 | 225 | 82 | 1,170 | -87 | 141 | -619 | -434 |
| 2020's | 1,483 | 110 |
| - = No Data Reported; -- = Not Applicable; NA = Not Available; W = Withheld to avoid disclosure of individual company data. |
| Release Date: 12/30/2022 |
| Next Release Date: NA |