|
Download Data (XLS File) |
|
|||||
|
|||||
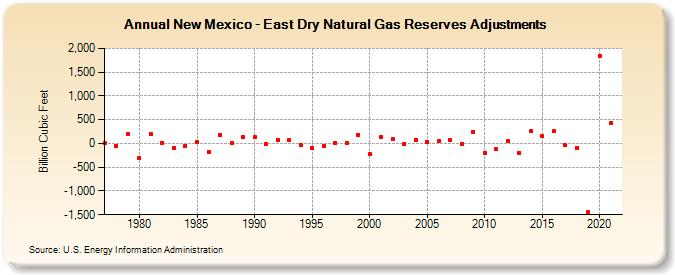
| New Mexico - East Dry Natural Gas Reserves Adjustments (Billion Cubic Feet) | |||||
| Decade | Year-0 | Year-1 | Year-2 | Year-3 | Year-4 | Year-5 | Year-6 | Year-7 | Year-8 | Year-9 |
|---|---|---|---|---|---|---|---|---|---|---|
| 1970's | 8 | -54 | 195 | |||||||
| 1980's | -302 | 196 | 15 | -92 | -54 | 26 | -179 | 185 | 13 | 130 |
| 1990's | 138 | -17 | 79 | 69 | -30 | -105 | -45 | 12 | 12 | 187 |
| 2000's | -221 | 136 | 98 | -14 | 80 | 37 | 56 | 82 | -8 | 251 |
| 2010's | -200 | -124 | 59 | -194 | 252 | 159 | 255 | -42 | -95 | -1,442 |
| 2020's | 1,845 | 436 |
| - = No Data Reported; -- = Not Applicable; NA = Not Available; W = Withheld to avoid disclosure of individual company data. |
| Release Date: 12/30/2022 |
| Next Release Date: NA |