|
Download Data (XLS File) |
|
|||||
|
|||||
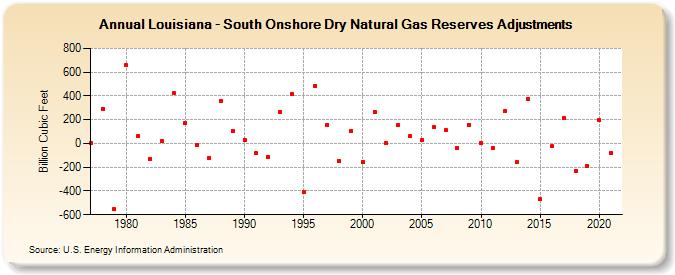
| Louisiana - South Onshore Dry Natural Gas Reserves Adjustments (Billion Cubic Feet) | |||||
| Decade | Year-0 | Year-1 | Year-2 | Year-3 | Year-4 | Year-5 | Year-6 | Year-7 | Year-8 | Year-9 |
|---|---|---|---|---|---|---|---|---|---|---|
| 1970's | 1 | 294 | -555 | |||||||
| 1980's | 656 | 64 | -127 | 20 | 421 | 176 | -14 | -121 | 359 | 107 |
| 1990's | 30 | -83 | -111 | 265 | 419 | -407 | 486 | 157 | -145 | 104 |
| 2000's | -154 | 267 | 1 | 154 | 60 | 32 | 135 | 110 | -39 | 159 |
| 2010's | 3 | -36 | 270 | -160 | 370 | -471 | -24 | 212 | -233 | -187 |
| 2020's | 197 | -80 |
| - = No Data Reported; -- = Not Applicable; NA = Not Available; W = Withheld to avoid disclosure of individual company data. |
| Release Date: 12/30/2022 |
| Next Release Date: NA |