|
Download Data (XLS File) |
|
|||||
|
|||||
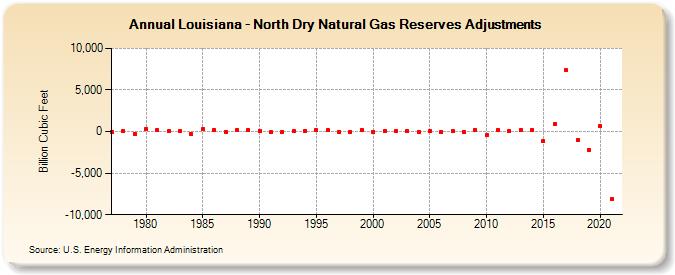
| Louisiana - North Dry Natural Gas Reserves Adjustments (Billion Cubic Feet) | |||||
| Decade | Year-0 | Year-1 | Year-2 | Year-3 | Year-4 | Year-5 | Year-6 | Year-7 | Year-8 | Year-9 |
|---|---|---|---|---|---|---|---|---|---|---|
| 1970's | -6 | 101 | -305 | |||||||
| 1980's | 331 | 136 | 15 | 95 | -322 | 265 | 182 | -13 | 170 | 164 |
| 1990's | 92 | -67 | -41 | 85 | 100 | 146 | 141 | 6 | -31 | 222 |
| 2000's | -20 | 49 | 90 | 95 | -12 | 69 | -27 | 70 | -36 | 167 |
| 2010's | -387 | 214 | 122 | 201 | 168 | -1,181 | 926 | 7,353 | -1,042 | -2,160 |
| 2020's | 692 | -8,123 |
| - = No Data Reported; -- = Not Applicable; NA = Not Available; W = Withheld to avoid disclosure of individual company data. |
| Release Date: 12/30/2022 |
| Next Release Date: NA |