|
Download Data (XLS File) |
|
|||||
|
|||||
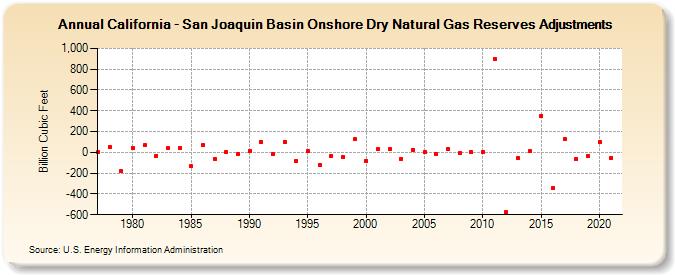
| California - San Joaquin Basin Onshore Dry Natural Gas Reserves Adjustments (Billion Cubic Feet) | |||||
| Decade | Year-0 | Year-1 | Year-2 | Year-3 | Year-4 | Year-5 | Year-6 | Year-7 | Year-8 | Year-9 |
|---|---|---|---|---|---|---|---|---|---|---|
| 1970's | -1 | 54 | -183 | |||||||
| 1980's | 46 | 66 | -31 | 37 | 43 | -136 | 66 | -63 | 3 | -14 |
| 1990's | 11 | 103 | -20 | 104 | -82 | 11 | -119 | -31 | -44 | 125 |
| 2000's | -79 | 28 | 29 | -60 | 26 | 5 | -12 | 31 | -8 | 2 |
| 2010's | 4 | 902 | -574 | -55 | 10 | 352 | -344 | 129 | -65 | -39 |
| 2020's | 102 | -52 |
| - = No Data Reported; -- = Not Applicable; NA = Not Available; W = Withheld to avoid disclosure of individual company data. |
| Release Date: 12/30/2022 |
| Next Release Date: NA |