|
Download Data (XLS File) |
|
|||||
|
|||||
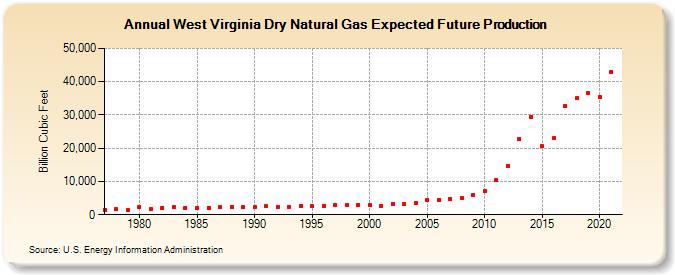
| West Virginia Dry Natural Gas Expected Future Production (Billion Cubic Feet) | |||||
| Decade | Year-0 | Year-1 | Year-2 | Year-3 | Year-4 | Year-5 | Year-6 | Year-7 | Year-8 | Year-9 |
|---|---|---|---|---|---|---|---|---|---|---|
| 1970's | 1,567 | 1,634 | 1,558 | |||||||
| 1980's | 2,422 | 1,834 | 2,148 | 2,194 | 2,136 | 2,058 | 2,148 | 2,242 | 2,306 | 2,201 |
| 1990's | 2,207 | 2,528 | 2,356 | 2,439 | 2,565 | 2,499 | 2,703 | 2,846 | 2,868 | 2,936 |
| 2000's | 2,900 | 2,678 | 3,360 | 3,306 | 3,397 | 4,459 | 4,509 | 4,729 | 5,136 | 5,946 |
| 2010's | 7,000 | 10,345 | 14,611 | 22,765 | 29,432 | 20,553 | 23,025 | 32,785 | 35,001 | 36,600 |
| 2020's | 35,247 | 43,023 |
| - = No Data Reported; -- = Not Applicable; NA = Not Available; W = Withheld to avoid disclosure of individual company data. |
| Release Date: 12/30/2022 |
| Next Release Date: NA |