|
Download Data (XLS File) |
|
|||||
|
|||||
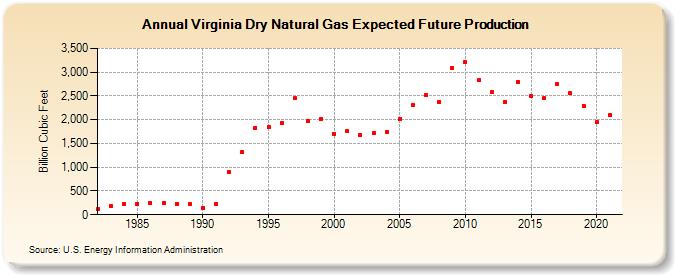
| Virginia Dry Natural Gas Expected Future Production (Billion Cubic Feet) | |||||
| Decade | Year-0 | Year-1 | Year-2 | Year-3 | Year-4 | Year-5 | Year-6 | Year-7 | Year-8 | Year-9 |
|---|---|---|---|---|---|---|---|---|---|---|
| 1980's | 122 | 175 | 216 | 235 | 253 | 248 | 230 | 217 | ||
| 1990's | 138 | 225 | 904 | 1,322 | 1,833 | 1,836 | 1,930 | 2,446 | 1,973 | 2,017 |
| 2000's | 1,704 | 1,752 | 1,673 | 1,717 | 1,742 | 2,018 | 2,302 | 2,529 | 2,378 | 3,091 |
| 2010's | 3,215 | 2,832 | 2,579 | 2,373 | 2,800 | 2,496 | 2,447 | 2,741 | 2,554 | 2,297 |
| 2020's | 1,950 | 2,093 |
| - = No Data Reported; -- = Not Applicable; NA = Not Available; W = Withheld to avoid disclosure of individual company data. |
| Release Date: 12/30/2022 |
| Next Release Date: NA |