|
Download Data (XLS File) |
|
|||||
|
|||||
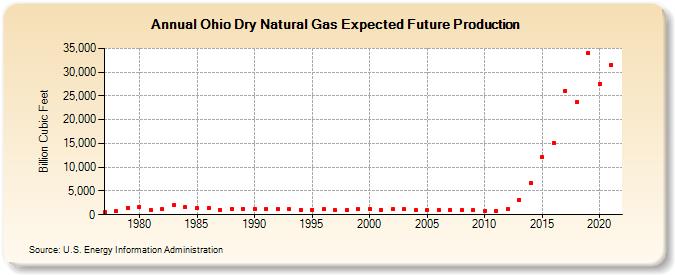
| Ohio Dry Natural Gas Expected Future Production (Billion Cubic Feet) | |||||
| Decade | Year-0 | Year-1 | Year-2 | Year-3 | Year-4 | Year-5 | Year-6 | Year-7 | Year-8 | Year-9 |
|---|---|---|---|---|---|---|---|---|---|---|
| 1970's | 495 | 684 | 1,479 | |||||||
| 1980's | 1,699 | 965 | 1,141 | 2,030 | 1,541 | 1,331 | 1,420 | 1,069 | 1,229 | 1,275 |
| 1990's | 1,214 | 1,181 | 1,161 | 1,104 | 1,094 | 1,054 | 1,113 | 985 | 890 | 1,179 |
| 2000's | 1,185 | 970 | 1,117 | 1,126 | 974 | 898 | 975 | 1,027 | 985 | 896 |
| 2010's | 832 | 758 | 1,233 | 3,161 | 6,723 | 12,104 | 15,143 | 26,123 | 23,759 | 34,056 |
| 2020's | 27,514 | 31,580 |
| - = No Data Reported; -- = Not Applicable; NA = Not Available; W = Withheld to avoid disclosure of individual company data. |
| Release Date: 12/30/2022 |
| Next Release Date: NA |