|
Download Data (XLS File) |
|
|||||
|
|||||
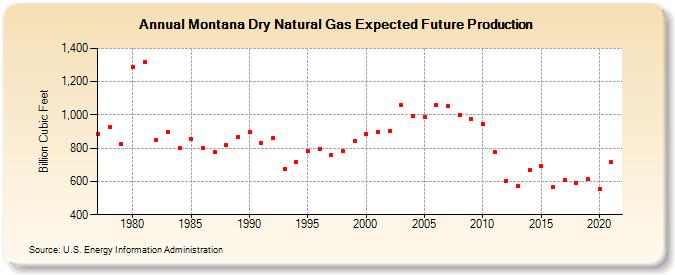
| Montana Dry Natural Gas Expected Future Production (Billion Cubic Feet) | |||||
| Decade | Year-0 | Year-1 | Year-2 | Year-3 | Year-4 | Year-5 | Year-6 | Year-7 | Year-8 | Year-9 |
|---|---|---|---|---|---|---|---|---|---|---|
| 1970's | 887 | 926 | 825 | |||||||
| 1980's | 1,287 | 1,321 | 847 | 896 | 802 | 857 | 803 | 780 | 819 | 867 |
| 1990's | 899 | 831 | 859 | 673 | 717 | 782 | 796 | 762 | 782 | 841 |
| 2000's | 885 | 898 | 906 | 1,059 | 995 | 986 | 1,057 | 1,052 | 1,000 | 976 |
| 2010's | 944 | 778 | 602 | 575 | 667 | 692 | 569 | 611 | 593 | 613 |
| 2020's | 555 | 715 |
| - = No Data Reported; -- = Not Applicable; NA = Not Available; W = Withheld to avoid disclosure of individual company data. |
| Release Date: 12/30/2022 |
| Next Release Date: NA |